
How to Read an MT5 Price Chart Without the Noise
A cluttered MT5 chart confuses more than it clarifies. Here's how to pick a chart type, timeframe, and reference lines without overloading the screen.
By LTI BLOG Team · Updated
How to Read an MT5 Price Chart Without the Noise
A clean MT5 chart usually tells you more than a busy one. Most people open MetaTrader 5 for the first time and start adding tools right away: a couple of moving averages, an oscillator, maybe a Fibonacci overlay, all stacked on top of the price candles. The chart fills up fast, but the picture rarely gets clearer.
Reading a price chart well has less to do with how many tools sit on it and more to do with knowing which few actually inform your decision. The rest is generally just noise dressed up as analysis. This guide covers MT5's chart types, how to pick a timeframe, how to add reference lines instead of stacking indicators, and where MT5 keeps the tools that make all of this possible.
Key Takeaways: • A chart with fewer, well chosen elements is usually easier to read than one loaded with indicators. • MT5 offers three chart types, candlestick, bar, and line, and each shows the same price data in a different way. • Your timeframe should match how long you intend to hold a position, not the other way around. • Reference lines you've marked yourself, such as support and resistance, tend to hold up better than a stack of automated indicator signals. • Most retail traders do not achieve consistent profitability, and no charting method or clean setup changes that on its own.
Risk disclosure: Trading in foreign exchange (forex), contracts for difference (CFDs), and other leveraged financial instruments involves a high degree of risk and may not be appropriate for all investors. You should only trade with funds that you can afford to lose without adversely affecting your financial position.
Why Chart Clutter Creates Analysis Paralysis
Every indicator on a chart is calculating something from the same underlying price data, just in a different way. A moving average smooths price over time. An oscillator measures momentum. A Fibonacci tool divides a prior move into ratios. Each one is a different lens on the same information.
Put three or four of these lenses on one chart and they will occasionally disagree, because they're built on different logic. One might suggest momentum is fading while another still points the other way. Rather than giving you a clearer signal, this usually leaves you waiting for a "confirmation" that never fully lines up.
That hesitation is the practical cost of clutter. It doesn't necessarily make your read of the market wrong, but it tends to slow the decision down and make it feel more complicated than it needs to be.
The Three Chart Types MT5 Offers, and When Each One Helps
MT5 gives you three ways to display the exact same price data, and switching between them changes what jumps out at you, not what actually happened in the market. Knowing what each one shows makes the choice a deliberate one instead of a default you never question.
- Candlestick: What it shows: Open, high, low, and close for each period, with a colored body showing whether price closed above or below where it opened | Where it tends to help: Spotting reversal patterns and shifts in buying or selling pressure at a specific level
- Bar: What it shows: The same open, high, low, and close data as a candlestick, shown as tick marks on a vertical line instead of a colored body | Where it tends to help: A less visually heavy read of the same information, useful once a chart already carries several drawing objects
- Line: What it shows: Only the closing price of each period, connected into a single line | Where it tends to help: Seeing the broader trend without the noise of every wick and shadow inside a session
You can switch between the three from MT5's toolbar or by right clicking the chart and choosing a chart type from the menu. None of the three change the underlying price data. They only change how it's displayed, so the choice comes down to which one makes the pattern you're actually looking for easiest to see.
Candlesticks are the default for most traders because the colored body makes it easy to see at a glance whether a period closed up or down, and where within its range. A bar chart carries identical information in a more compact, less colorful form, which some traders prefer once a chart already has several lines and shapes drawn on it. A line chart strips out the high and low of each period entirely and just tracks the close, which is often the simplest way to see a trend without getting pulled into every small swing a busy session produces.
Choosing a Timeframe That Fits Your Trading Style
The timeframe you look at should match how long you actually intend to hold a position, not whichever chart happens to be open. MT5's timeframe selector runs from M1 through MN1, covering everything from one minute charts up to monthly ones, and each shows a genuinely different version of the same market.
Someone planning to hold a position for days or weeks generally gets more useful information from a daily or four hour chart, where short term price swings are smoothed out by the wider view. Someone looking to be in and out within a session tends to work on M15 or H1 charts instead, where that detail actually matters.
Switching between several timeframes to check the same decision can feel like due diligence, but it often just adds more inputs to reconcile. Picking the timeframe that matches your actual holding period first, then staying there for that decision, tends to keep the read simpler.
Trading hours and typical spread behavior also vary by instrument and by session, and that matters more on shorter timeframes than longer ones. The trading conditions page lists the specifics for each market, worth checking before settling on an intraday timeframe for a particular pair or index.
How Reference Lines Differ from Stacked Indicators
A support or resistance line you've drawn yourself is a different kind of tool from an indicator overlay. You're marking a price level where the market has previously turned, paused, or reacted, based on what actually happened on the chart. An indicator, by contrast, is generating a calculated signal from a formula applied after the fact. Drawing one in MT5 takes a few clicks: the horizontal line and trendline tools sit in the Insert menu under Objects, and either one snaps to the price you click on the chart.
Manually drawn reference lines, horizontal levels at prior swing highs or lows, or a trendline connecting a series of higher lows, tend to stay relevant because they're anchored to specific price events you can point to. Indicators can shift their reading as new data comes in, sometimes flipping a signal shortly after it fires.
This isn't a case against using any indicators at all. It's a distinction worth keeping in mind: a few lines that describe what price has actually done tend to add more clarity than several indicators layered on top of each other, each casting its own vote.
Where MT5 Keeps Its Charting Tools
Most of what this guide describes lives in two places in MT5: the Insert menu and the Data Window. The Insert menu is where indicators, objects such as lines and channels, and shapes all come from, so it's the one menu worth knowing well even if you only ever use two or three tools from it.
The Data Window, opened from the View menu or with Ctrl+D, shows the exact open, high, low, and close for whichever candle or bar your cursor is sitting on, along with the values of any indicators applied to the chart. It's a more precise way to check a specific price than reading it off the chart by eye, and it's genuinely useful for confirming exactly where a level sits before you draw a line at it.
Once a chart is set up the way you want it, meaning a chart type, a timeframe, a couple of reference lines, and maybe one indicator, MT5 lets you save that as a template from the Charts menu and apply it to any other instrument in one step. That's a practical way to keep the same clean setup instead of rebuilding it from scratch every time you open a new symbol.
What a Clean MT5 Chart Setup Looks Like
A workable MT5 setup is usually simpler than it sounds. Price displayed as candlesticks or bars, a small number of horizontal or trend lines marking levels you've identified, and perhaps one indicator you understand well and use consistently. That's often enough.
[IMAGE: Clean minimal MetaTrader 5 candlestick chart with a few horizontal support and resistance lines. Search terms: forex candlestick chart clean minimal]
Everything beyond that is worth questioning. If removing an indicator from the chart wouldn't change the decision you're about to make, it's probably not adding value, it's just occupying screen space. Going through an existing chart and removing tools one at a time, checking whether the read actually changes, is a reasonable way to find out what's actually necessary and what isn't.
Testing a setup like this costs nothing on a demo account, and the same clean chart carries over once you move to live trading. LTI's account types page compares the Core and ECN accounts if you're deciding which one to open once you're ready to move off demo.
How to Read Price Movement Without Predicting It
Reading a chart mechanically means describing what price has done, not forecasting what it will do next. That distinction matters, because a chart can only show you history: where price has been, how far it has moved from a level, whether recent candles are making higher highs or lower lows.
Practically, this looks like noting the current price relative to a level you've already marked, checking whether the recent range is expanding or contracting compared with prior sessions, and observing how price has behaved the last few times it approached a similar area. None of that tells you what happens next. It describes the present position, which is a different thing.
It's worth being direct about this: most retail traders do not achieve consistent profitability, and a cleaner chart or a better organized set of reference lines doesn't remove that reality. Reading price clearly is one input into a decision, not a method that turns uncertainty into a reliable edge.
Where to Find More on the MT5 Platform
The charting tools covered here, chart types, timeframes, drawing objects, indicator settings, and templates, all sit inside the same terminal. The MT5 platform page covers what's available on desktop and mobile if you want to see the full feature set before applying any of this.
If you'd rather set rules around a level once you've marked it, instead of watching the chart and deciding by hand every time, that's what the trading automation page covers. And if you're already pairing an AI assistant with your MT5 terminal, How to Enable Native MCP in MetaTrader 5 walks through connecting one so it can read the same chart data you do.
Charts, however clean, only show what price has already done. Trading forex, metals, indices, energies, or crypto CFDs carries a real risk of loss, and no way of reading a chart removes that.
Frequently Asked Questions
Does adding more indicators make an MT5 chart more accurate?
No, not necessarily. Each indicator applies a different calculation to the same price data, and stacking several of them tends to produce conflicting readings rather than a clearer one.
What timeframe should a beginner use on MT5?
Generally, whichever timeframe matches how long you plan to hold a position. Someone testing shorter term ideas usually works on M15 or H1 charts, while someone considering longer holds tends to look at H4 or daily charts instead.
Should I remove indicators that disagree with each other?
Generally yes, or at least reduce them to the ones you actually understand and use consistently. If an indicator's signal wouldn't change your decision either way, it's likely adding clutter rather than clarity.
What's the difference between a candlestick chart and a bar chart on MT5?
Not much in the underlying data. Both show the open, high, low, and close for each period. A candlestick uses a colored body to make the open to close range easy to see at a glance, while a bar chart shows the same four prices as tick marks on a vertical line. Which one is easier to read comes down to personal preference more than accuracy.
How do I check the exact price of a candle instead of reading it off the chart by eye?
Open the Data Window from the View menu, or press Ctrl+D, and hover over the candle you want. It shows the exact open, high, low, and close for that period, along with any indicator values applied to the chart, which is more precise than estimating from the chart's scale.
*This article is general information about CFDs, leveraged products and instruments, and trading. It is not investment advice, a recommendation, or an offer to trade, and it does not take account of your objectives, financial situation or needs. Refer to the footer for the full disclaimer, terms and policies.
Related Articles
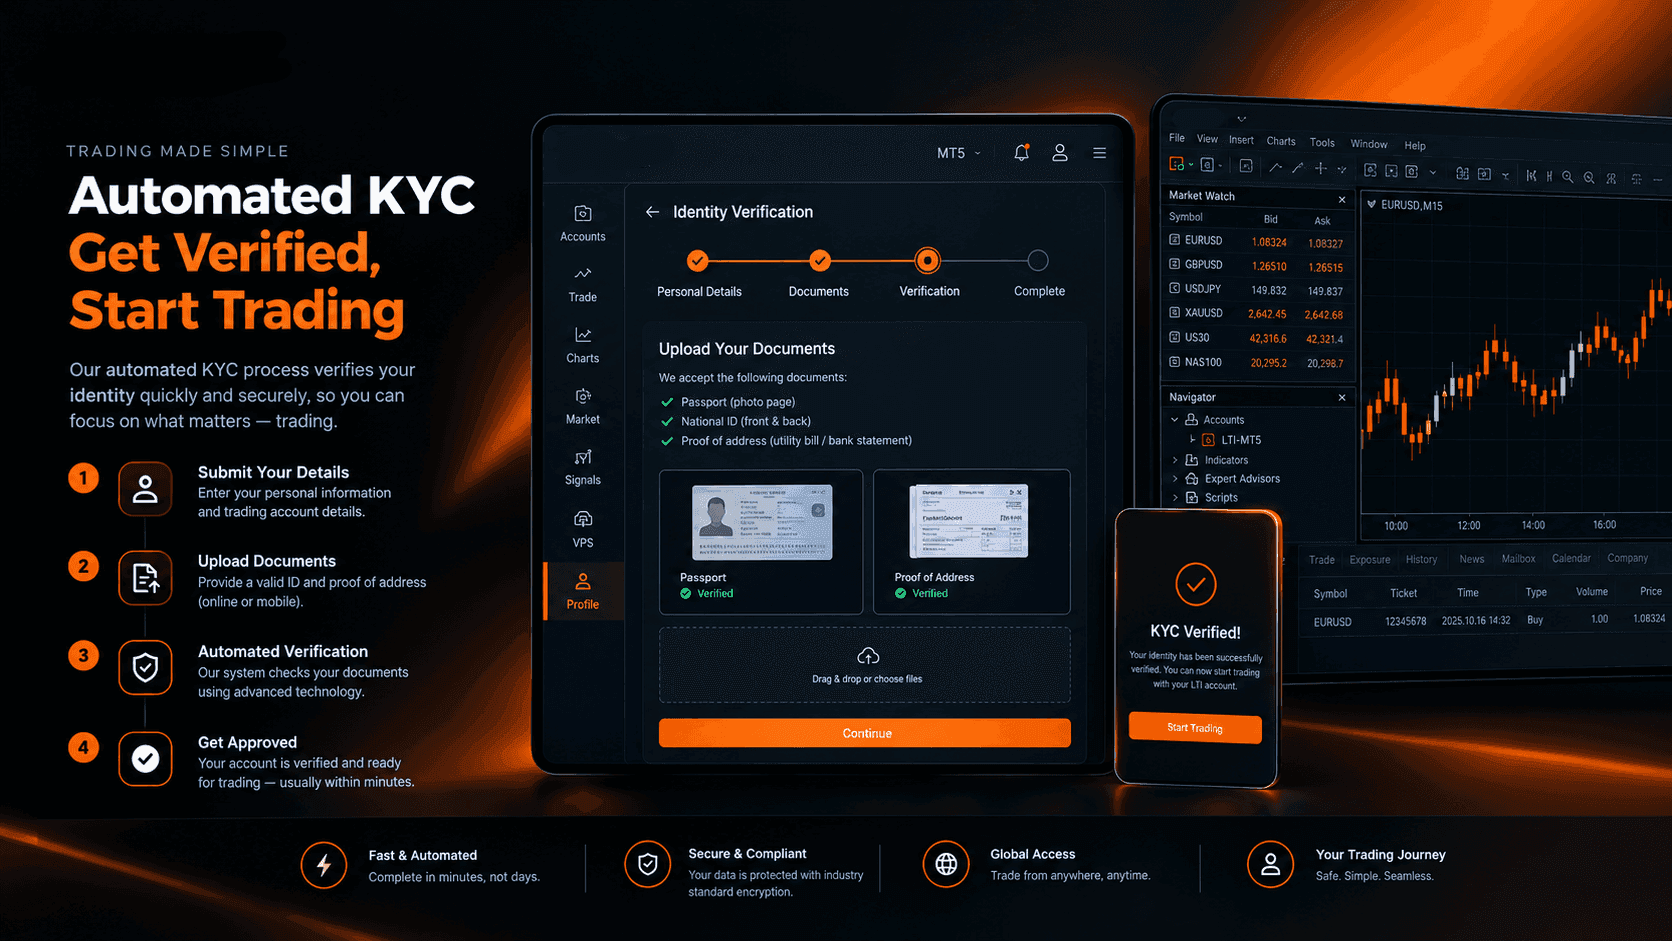
How Automated KYC Verification Actually Works at LTI
KYC verification is required before you can trade with LTI, not optional. Here's how the automated process works and how fast it can be.
Read Article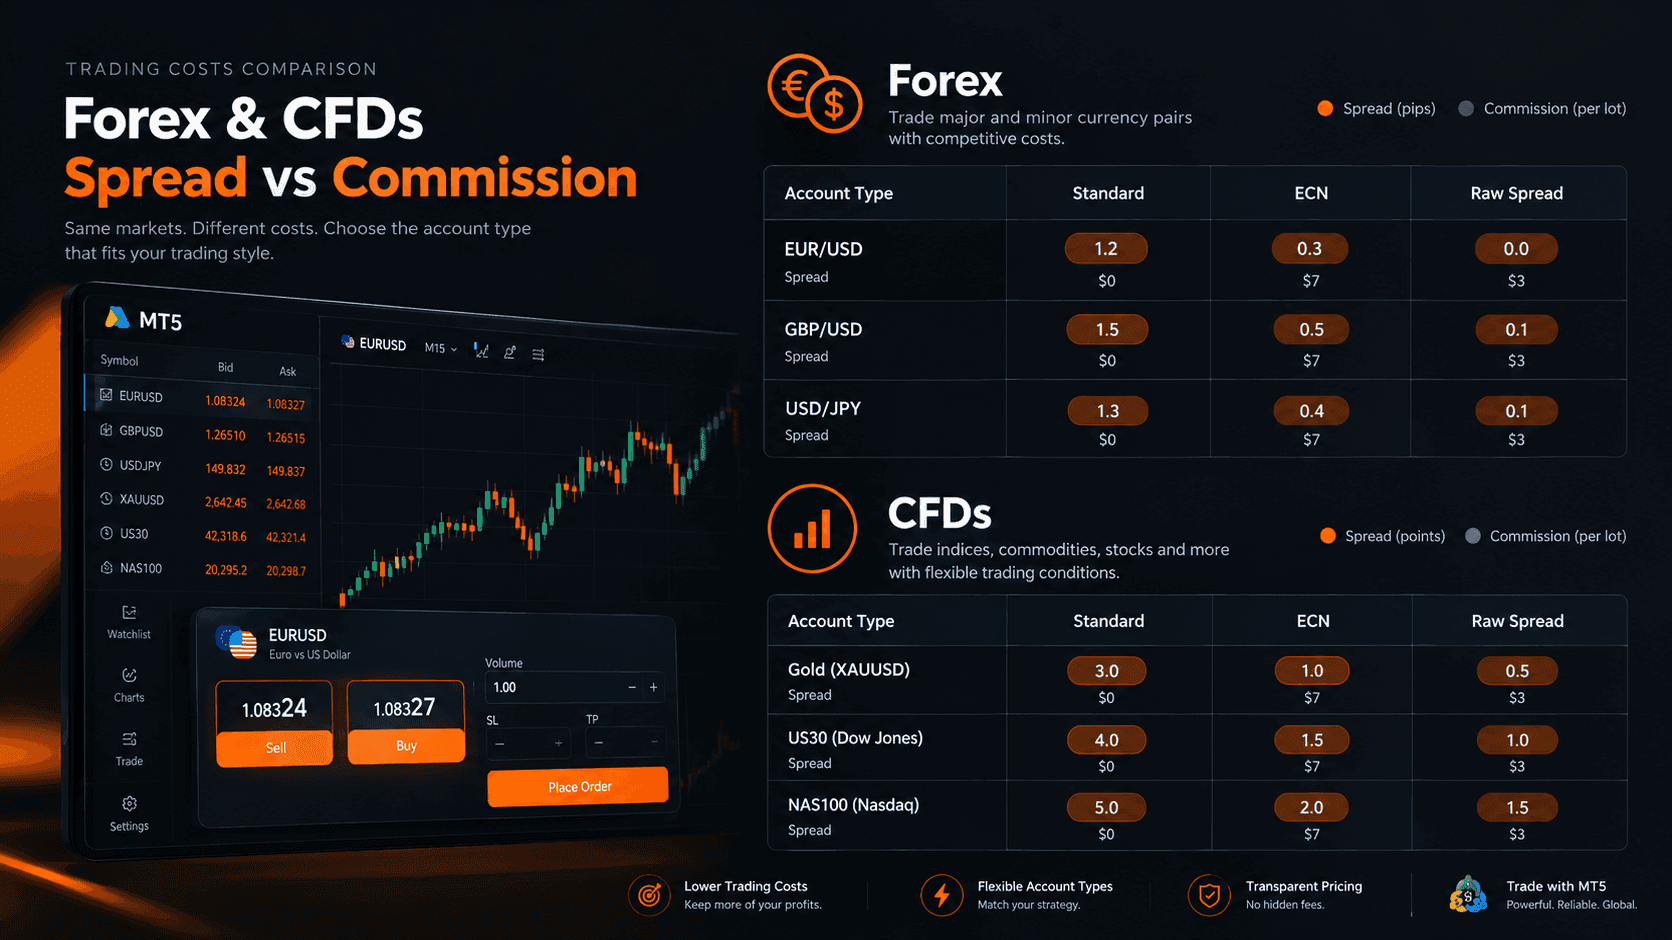
Forex and CFD Spreads vs Commissions: What They Really Cost You
A tight spread can still cost more once commission is added in. Here's how to compare total cost per trade instead of judging each fee alone.
Read Article
Copy Trading, PAMM, and MAM: What's the Difference?
Copy trading, PAMM, and MAM handle risk differently. Here's what actually separates the three account structures.
Read ArticleCreate Your Account
Account opening happens in the client area, and takes a couple of minutes.
*Opening an account finishes in the secure client area, where these details carry across. Already registered? Sign in, or talk to us first.
CFDs are complex instruments and come with a high risk of losing money rapidly due to leverage. 73% of retail investor accounts lose money when trading CFDs. You should consider whether you can afford to take the high risk of losing your money.